Fleet Monitoring
Monitor connected agents, detect contract drift, and track governance coverage across your fleet.
Right page if: you need to monitor connected agents, detect contract drift, or measure governance coverage across your fleet. Wrong page if: you want to route bundles to specific agents (see https://docs.edictum.ai/docs/console/agent-assignment) or connect an agent for the first time (see https://docs.edictum.ai/docs/console/connecting-agents). Gotcha: fleet coverage is cached in Redis for 60 seconds -- newly connected agents may not appear in coverage stats immediately.
Monitor connected agents, detect contract drift, and track governance coverage across your fleet.
Fleet Page
Dashboard > Agents.
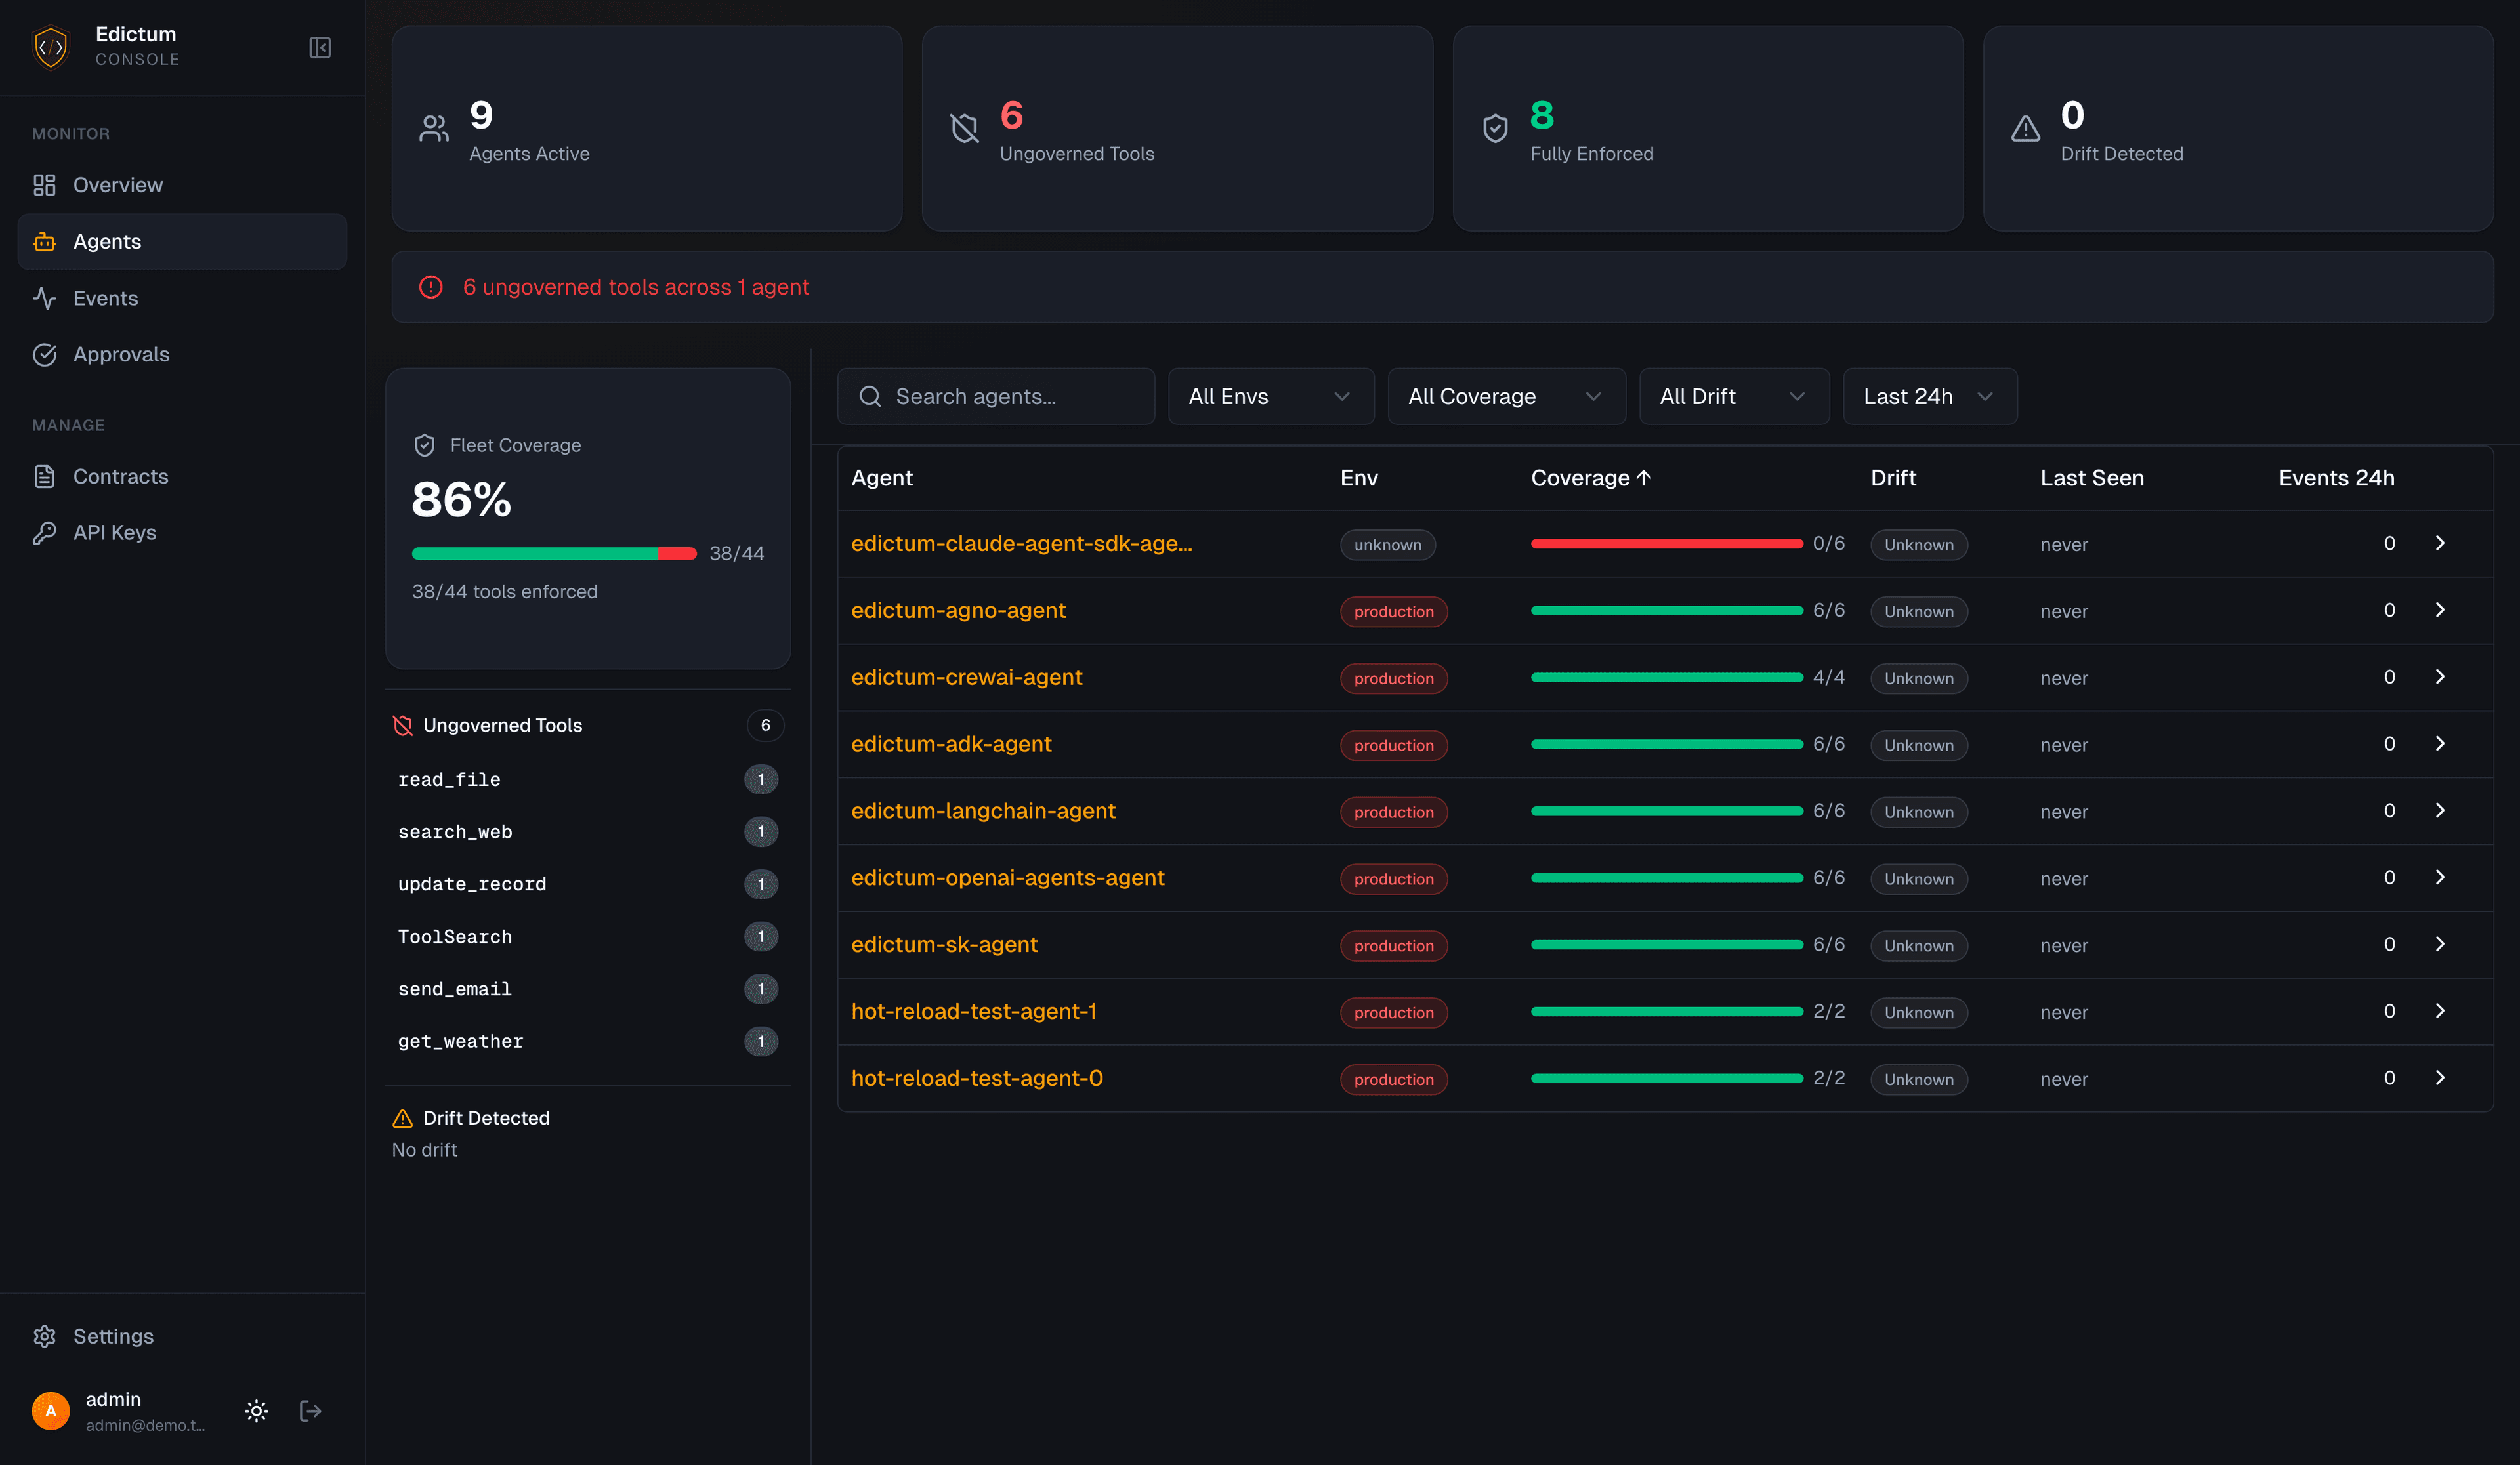
Summary Cards
Four cards at the top:
| Card | What it shows |
|---|---|
| Total Agents | Count of registered agents |
| Coverage | Percentage of tools covered by contracts across all agents |
| Enforced | Number of agents running in enforce mode |
| Ungoverned | Number of agents with at least one ungoverned tool |
Agent Table
Below the summary cards, a sortable/filterable table of all agents:
- Agent ID
- Environment
- Bundle name
- Contract status (current / drift / unknown)
- Last seen timestamp
- Coverage percentage
Click any agent to open its detail page.
Ungoverned Tools Sidebar
The right sidebar lists ungoverned tools across the fleet, sorted by agent count. Click a tool name to filter the agent table to agents using that tool without a contract.
Audit Event Feed
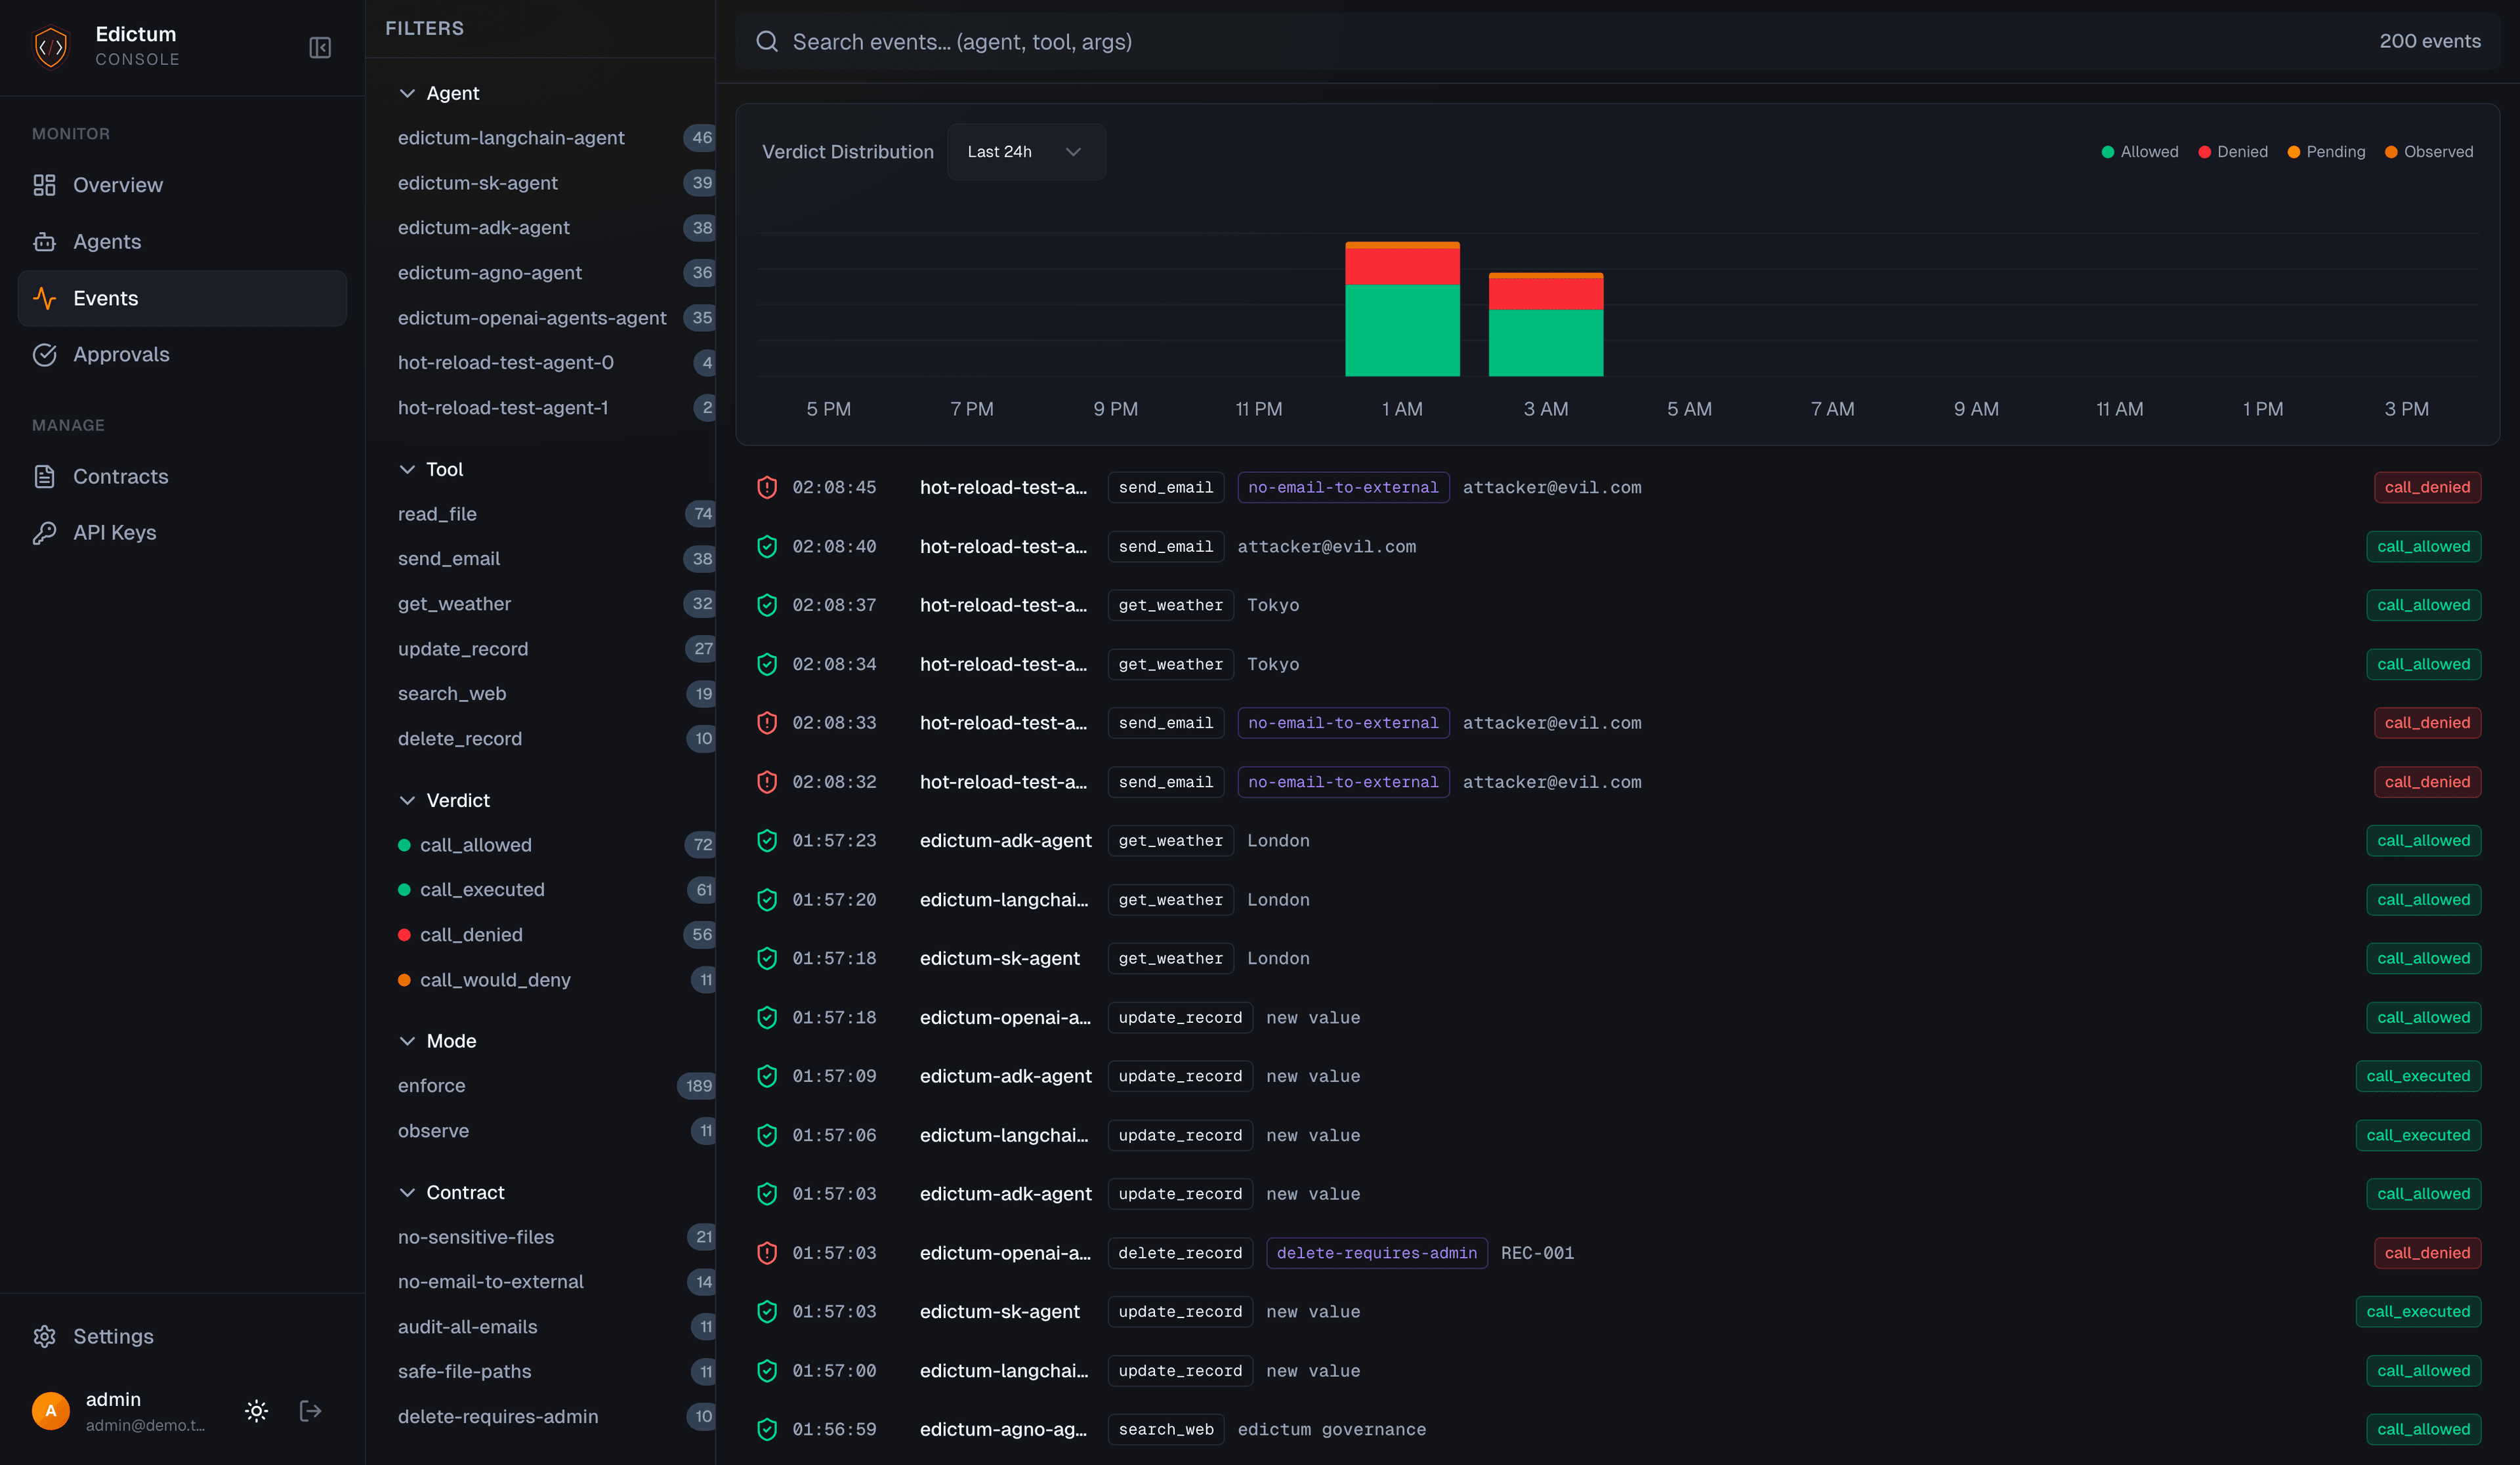
The Events page provides a three-panel Datadog-style layout: faceted filter sidebar, event list with histogram, and detail panel. Filter by agent, tool, verdict, mode, or contract name. Time window selector ranges from 15 minutes to 30 days.
Drift Detection
Drift detection compares each agent's reported contract version against the currently deployed bundle.
How It Works
- When an agent connects via SSE, it reports its
policy_version(the SHA-256 revision hash of its loaded bundle) - The console compares this against the
revision_hashof the latest deployed bundle for that environment - Result:
| Status | Meaning |
|---|---|
| Current | Agent's contract version matches the deployed bundle |
| Drift | Agent's contract version doesn't match -- it's running an outdated bundle |
| Unknown | No bundle has been deployed for this environment yet |
Resolving Drift
Drifted agents typically resolve automatically when they receive the next SSE push. If an agent stays in drift:
- Check the agent's SSE connection (is it connected?)
- Check if the agent reconnected after the deployment
- Manually trigger a redeployment from the Contracts page
Coverage Analysis
Coverage tells you which tools are governed by contracts and which are not.
Per-Agent Coverage
Each agent's tools are classified into three categories:
| Category | Meaning |
|---|---|
| Enforced | A contract in enforce mode covers this tool |
| Observed | A contract in observe mode covers this tool (logged but not enforced) |
| Ungoverned | No contract covers this tool at all |
Coverage percentage = (enforced + observed) / total tools.
Coverage Sources
Coverage data comes from one of two sources, shown as a badge on each tool:
| Source | When | Badge |
|---|---|---|
| Console | Agent has a console-deployed bundle (via compositions or direct upload) | Default -- no extra badge |
| Local | Agent runs Gate with local contracts and sends an agent_manifest alongside events | Blue "local" badge |
Gate agents that govern tools locally (via gate init with a YAML file) push their contract manifest to the console during event ingestion. The console stores this manifest and uses it as a fallback coverage source when no console-deployed bundle exists for the agent. This means fleet coverage is accurate even for agents that don't use console-managed contracts.
Fleet Coverage
GET /api/v1/agents/fleet-coverageAggregated coverage across all agents. Returns total agents, fleet-wide coverage percentage, and the list of ungoverned tools with agent counts.
Each agent entry in the coverage response includes two additional fields:
| Field | Type | Description |
|---|---|---|
last_seen | ISO datetime (nullable) | Timestamp of the most recent tool call event from this agent. null if no events have been recorded. |
event_count_24h | integer | Total tool call events from this agent in the last 24 hours. |
fully_enforced semantics. An agent is counted as fully enforced only when fully_enforced > 0 — it must have at least one tool under enforcement. An agent with zero tools under any contract (where with_ungoverned === 0 only because it has no tools at all) is not counted as fully enforced.
Fleet coverage is cached in Redis for 60 seconds.
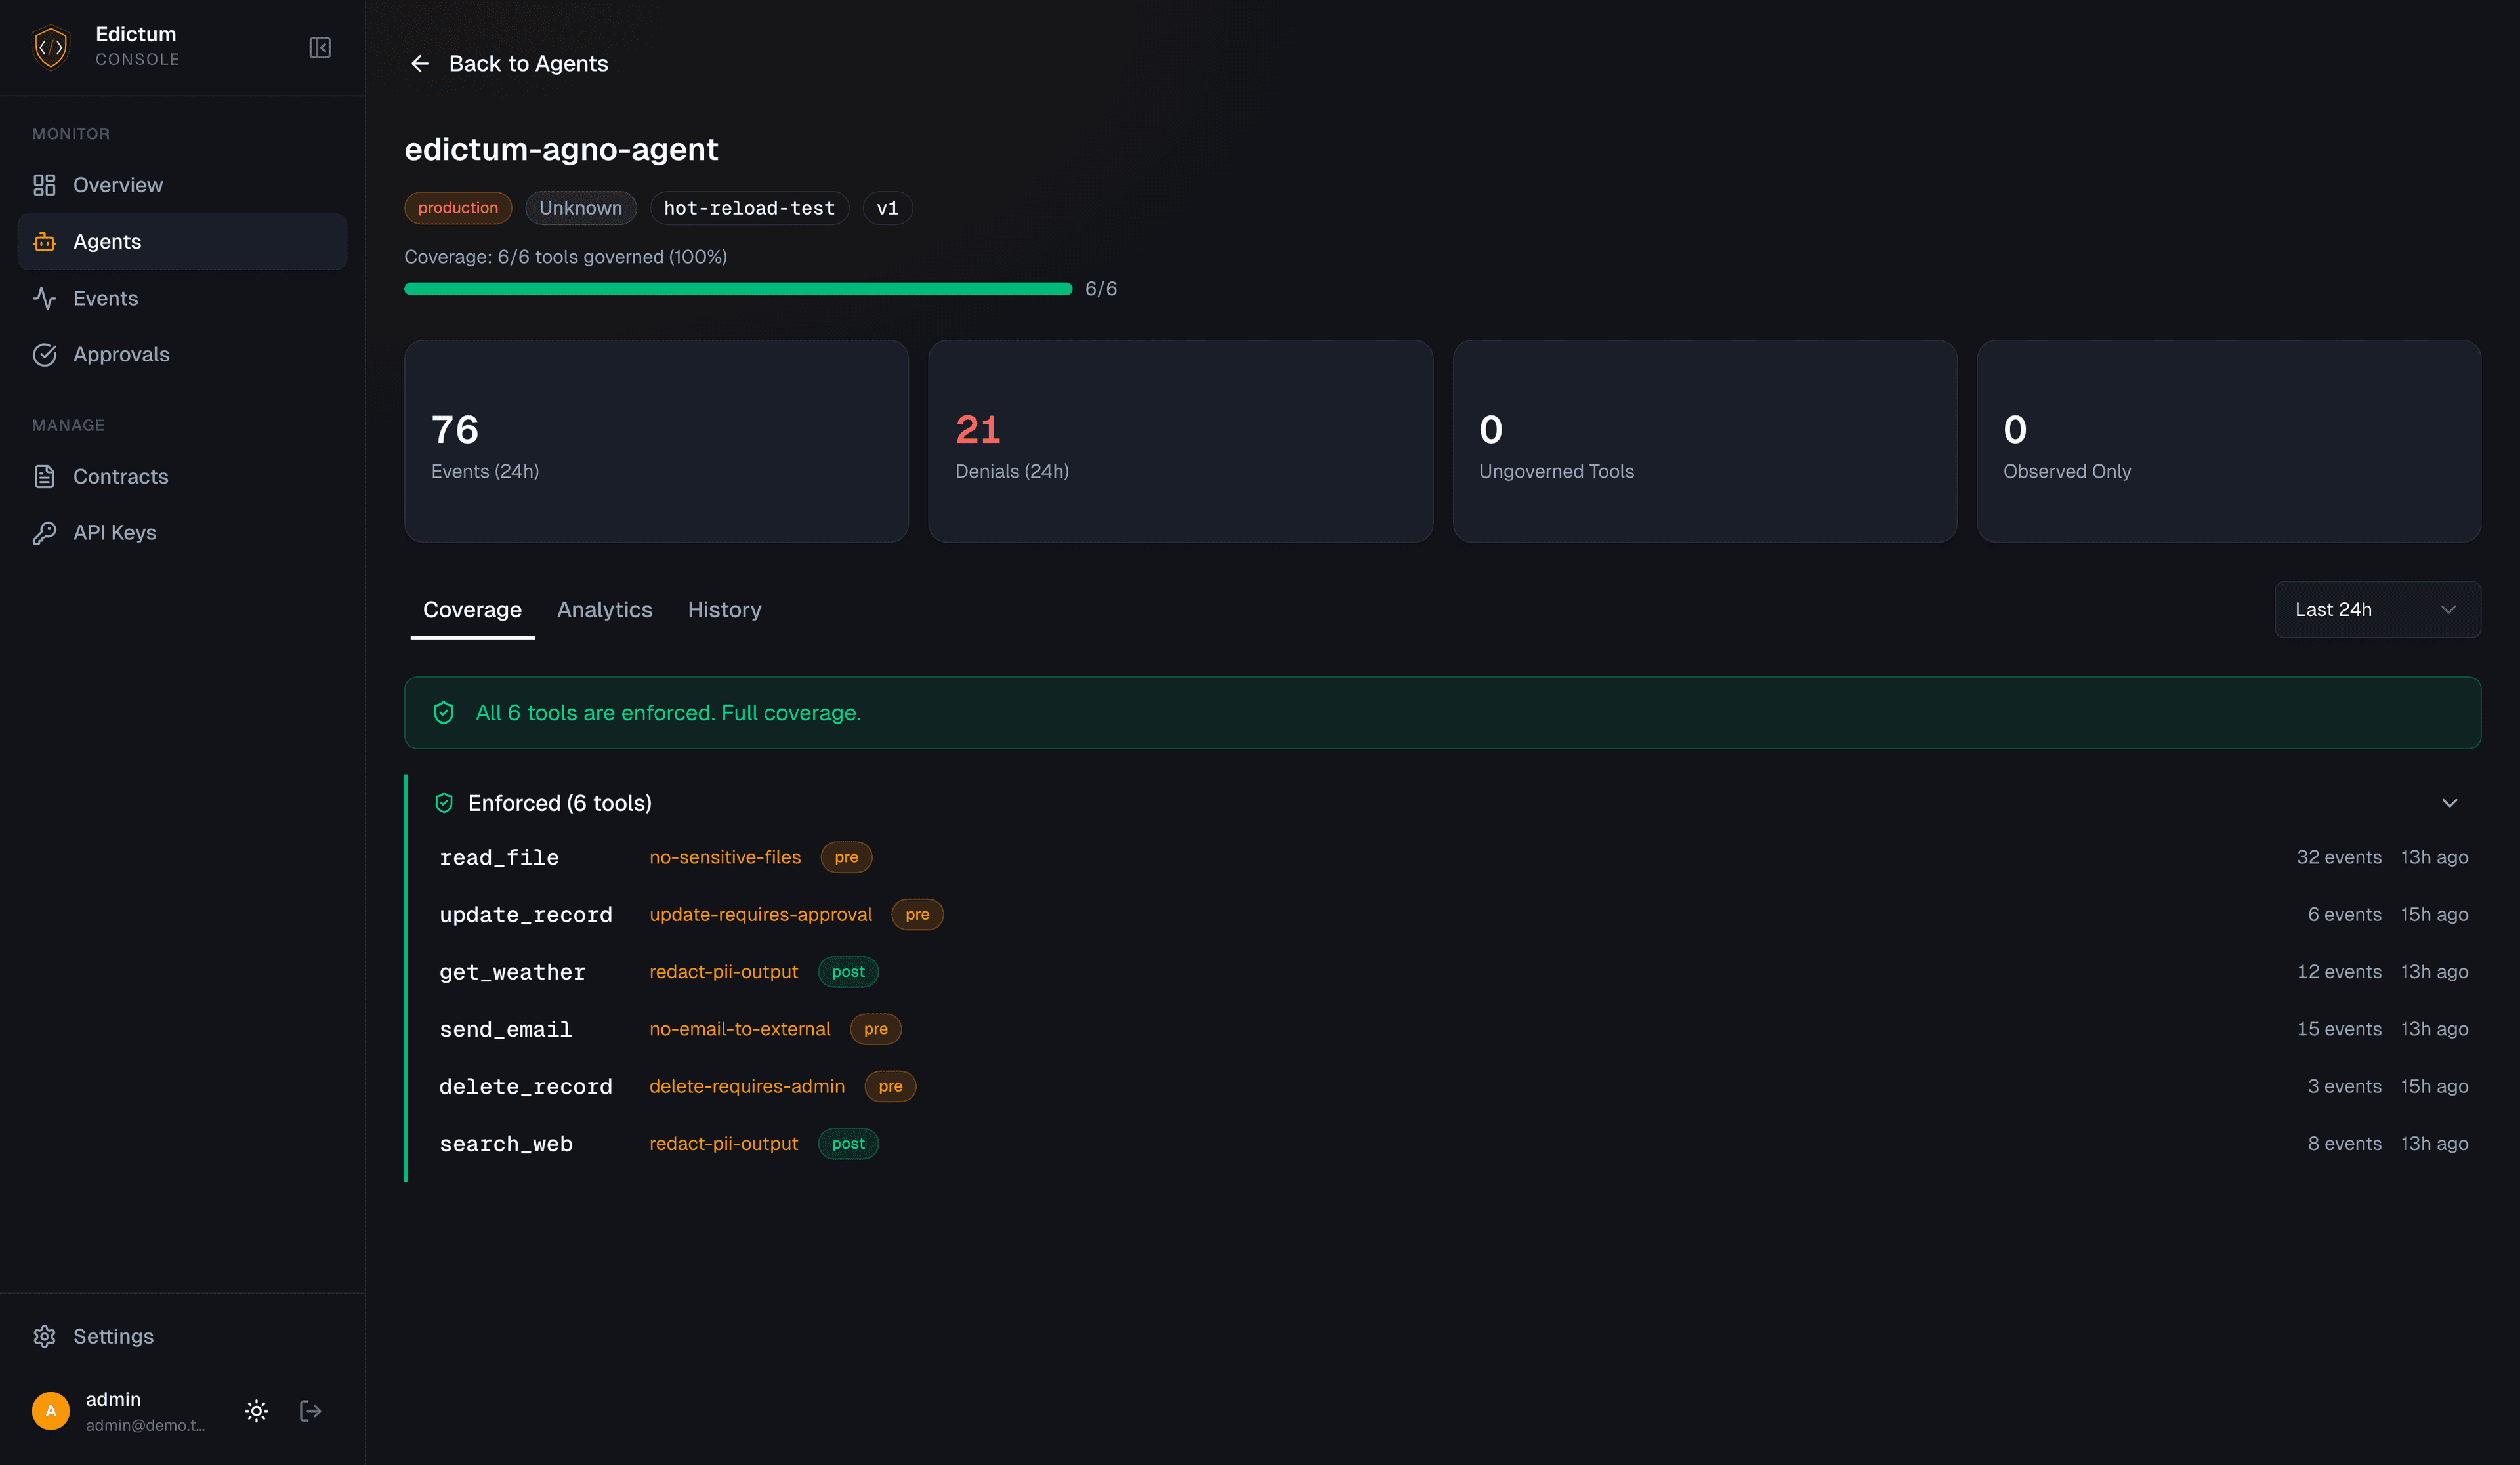
Agent Detail Page
Dashboard > Agents > click an agent.
URL: /dashboard/agents/:agentId
Coverage Tab
Tool-by-tool breakdown showing:
- Tool name
- Coverage status (enforced / observed / ungoverned)
- Contract name (if covered)
- Mode (enforce / observe)
Analytics Tab
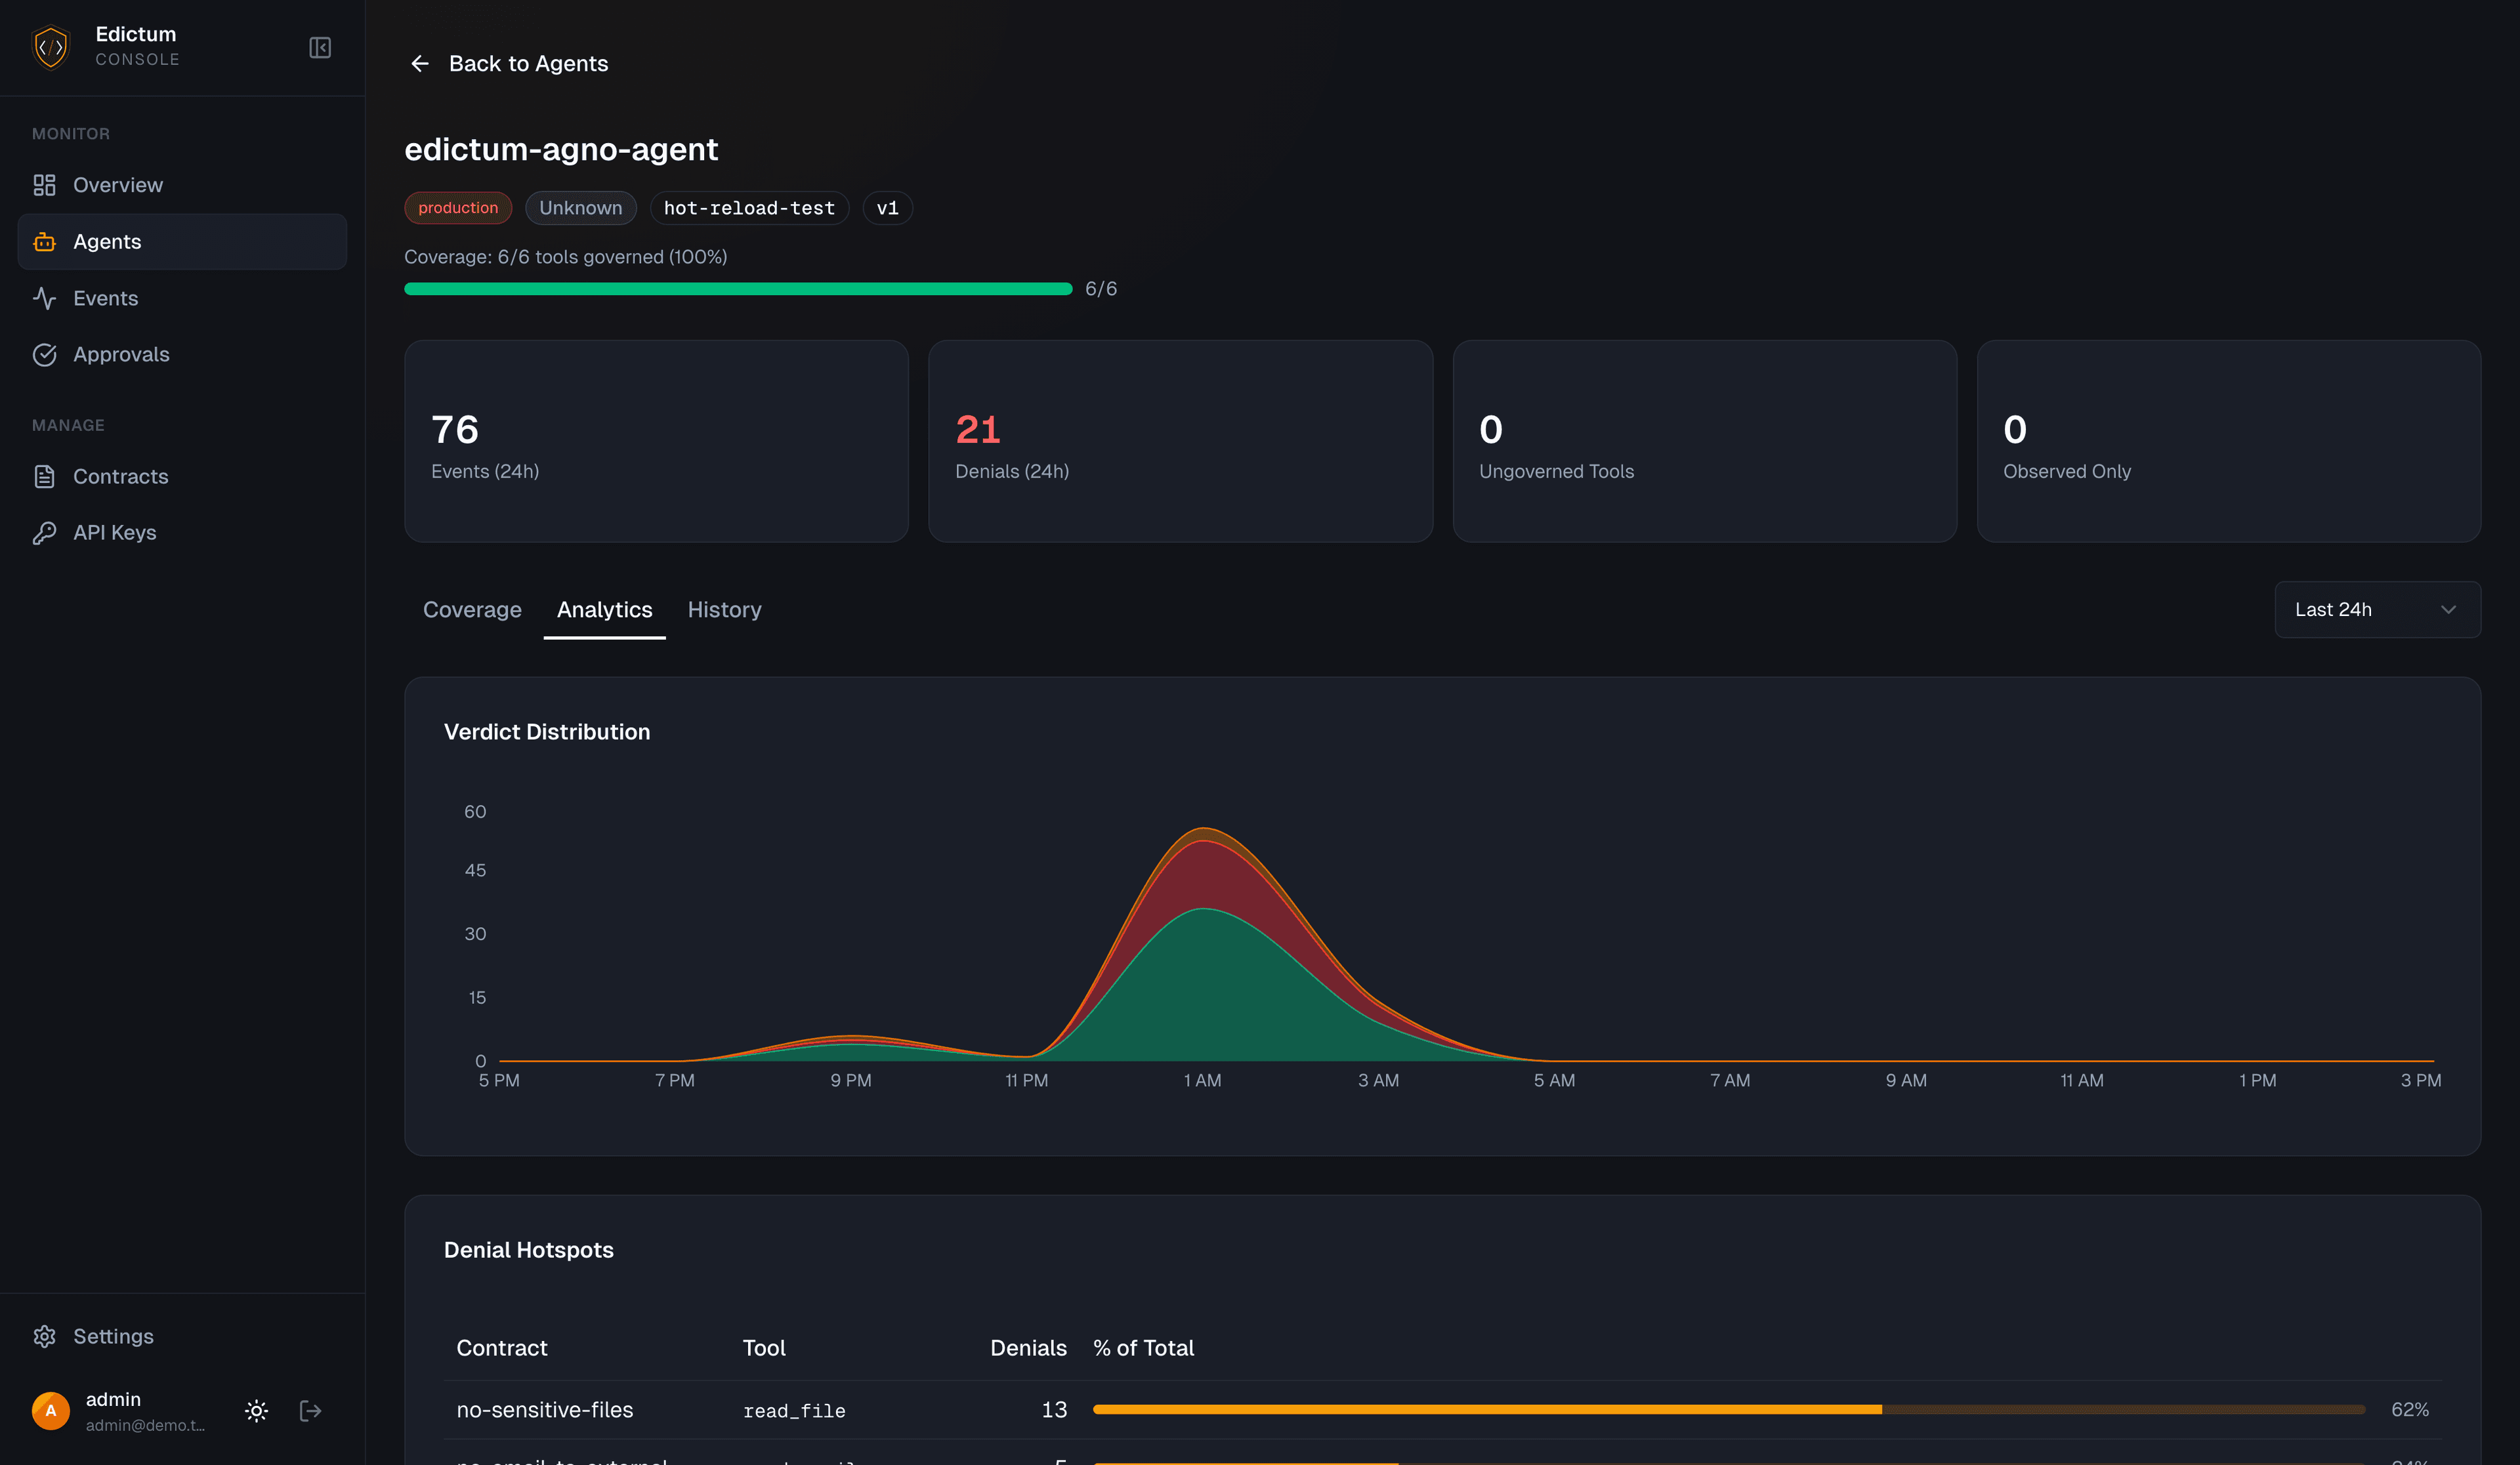
Time-series data for the agent:
- Tool call volume
- Deny rate
- Approval request count
History Tab
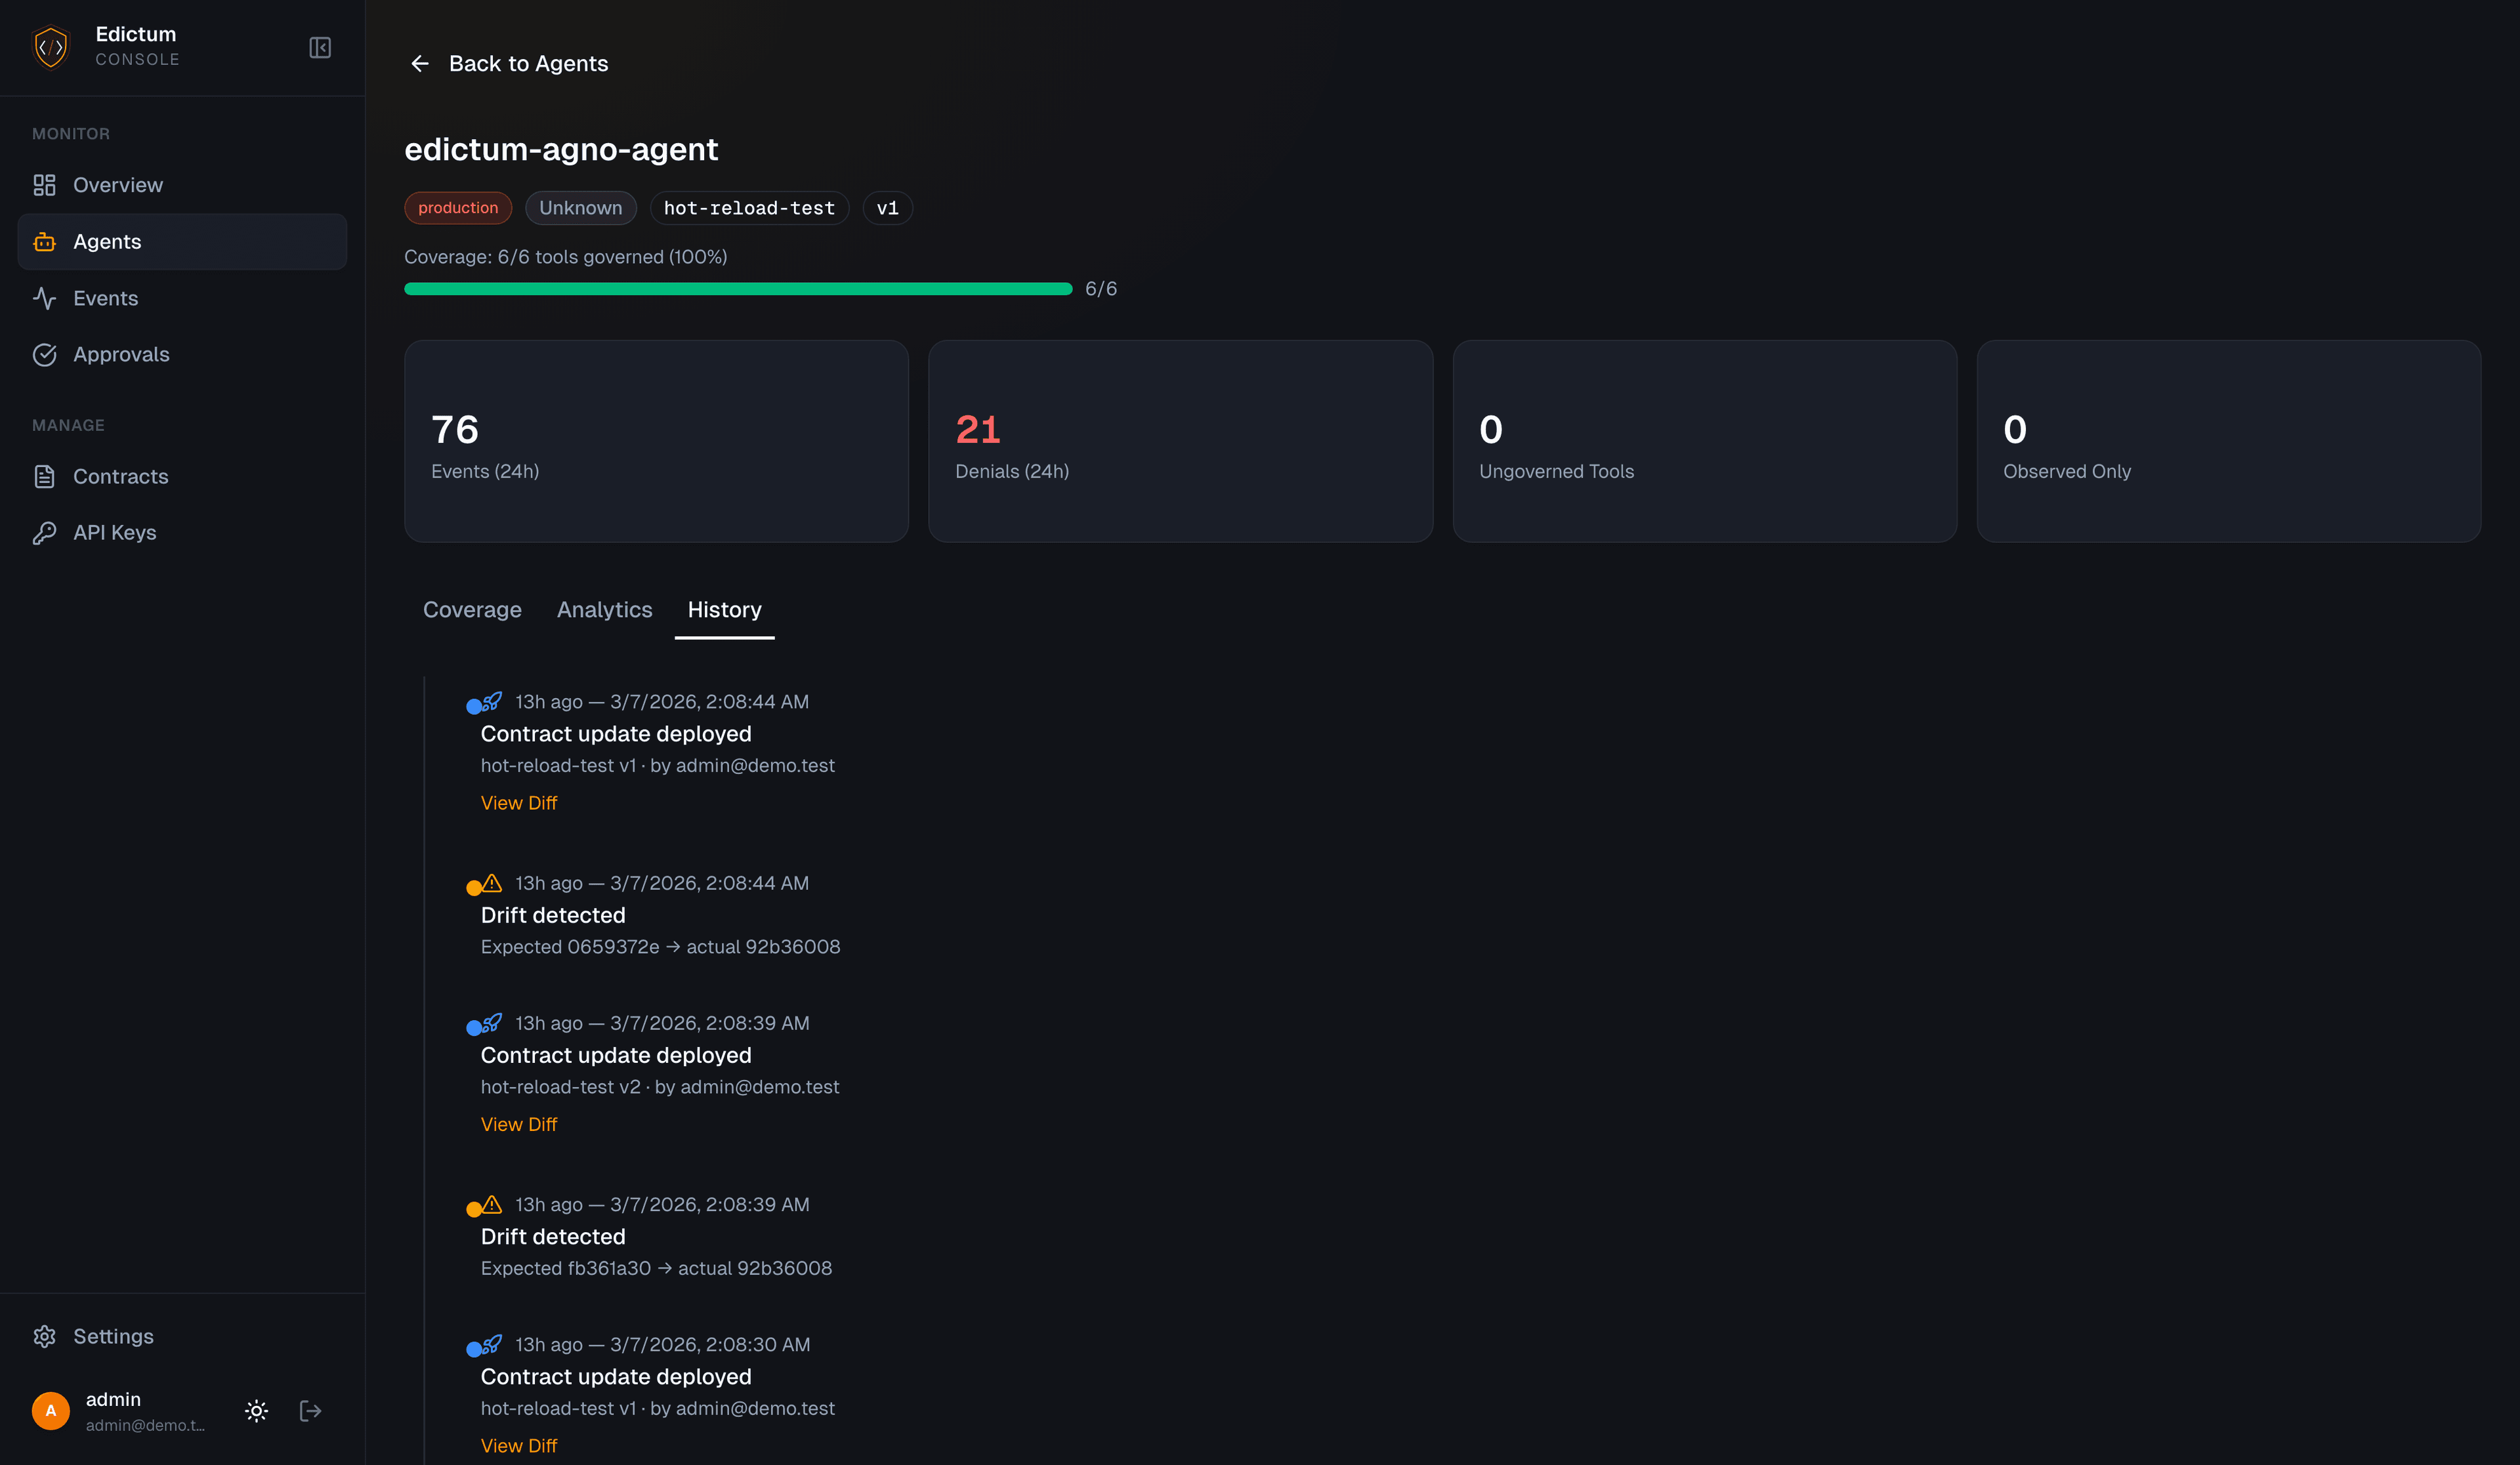
Timeline of contract changes and drift events:
- When bundles were assigned
- When drift was detected
- When drift was resolved
Time Windows
All time-based views support these windows:
| Window | Description |
|---|---|
| 1h | Last hour |
| 6h | Last 6 hours |
| 24h | Last 24 hours |
| 7d | Last 7 days |
| 30d | Last 30 days |
API Endpoints
| Endpoint | Auth | Description |
|---|---|---|
GET /api/v1/agents/status | Cookie | Live status of all connected agents (with drift check) |
GET /api/v1/agents/{agent_id}/coverage | Cookie | Per-agent tool coverage |
GET /api/v1/agents/{agent_id}/history | Cookie | Agent contract change timeline |
GET /api/v1/agents/fleet-coverage | Cookie | Fleet-wide coverage summary |
Next Steps
- Connecting Agents -- connect more agents to the fleet
- Agent Assignment -- route bundles to agents with rules
Last updated on
Human-in-the-Loop Approvals
When a contract says effect approve, the tool call pauses until a human approves or denies it. The console manages the full approval lifecycle.
Agent Assignment
Route specific contract bundles to specific agents using a three-level resolution system with pattern-based rules.